
.png)
Are you fascinated by data? Are you keen to start a career in the field of data? Here is some exciting news: get ready to discover the world of endless possibilities and opportunities in the data field!
Data is everywhere, and those who understand how to work with it wield significant influence. US Bureau Of Labour Statistics has estimated a 36% growth rate (much faster than average) in the field of data scientists. According to Cision PR Newswire, by 2025, the big data market is expected to reach a staggering $229.4 billion, signalling a significant boom in the data industry. The increase is associated with a rise in demand for people who can manage data.
Data is like crude oil without refining; it is useless. Data Analytics is the refinery that transforms it into valuable fuel, propelling businesses towards success.
“Data analytics is the future, and the future is NOW! Every mouse click, keyboard button press, swipe or tap shapes business decisions. Everything is about data these days. Data is information, and information is power.” - Radi, Data Analyst at CENTOGENE.
In this blog
What Is Data Analytics?
Data Analytics is the systematic process of examining, interpreting, and drawing meaningful insights from raw data. Data Analytics looks at raw data and refines it in a way which can conclude its information, often intending to discover valuable insights to support decision-making. Moreover, it is like revealing hidden stories inside a sea of numbers, allowing businesses and individuals to make wise decisions.
Understanding Data Analytics
Businesses use data analytics to systematically analyse data, draw conclusions, and make well-informed decisions. Various methods and technologies draw patterns, trends, and insightful information from datasets. In a nutshell, it involves transforming unactionable information into knowledge.
Fundamentally, data analytics is searching through data to find important information. These details may include consumer preferences and behaviours, operational effectiveness, and market trends. It's like receiving a jigsaw puzzle, and data analytics is the activity of assembling the parts to produce a distinct image.
Data analytics uses statistical analysis, machine learning algorithms, and visualisation tools to make sense of the data.
For example, imagine a factory that makes things. They keep track of how long the machines work and when they stop. Using data analysis, they figure out how to make the machines work better.
But data analysis isn't just for factories. In games, they use it to give out rewards in a way that keeps most players interested. In shows and videos, they use it to decide what to show you next, to keep you watching or clicking for more.
Data Analysis can be used in every industry and every niche, as everything revolves around data.
Steps of Data Analytics
There are several steps involved in data analytics, which are as follows:
1. Data collection: Gathering data from various sources to build a comprehensive dataset for analysis.
2. Data Cleaning and Preparation: Ensuring data quality and consistency before analysis.
3. Data Analysis: Uncovering trends and patterns in data to gain insights.
4. Data Modeling: Creating mathematical data representations to make predictions and reach conclusions.
5. Interpretation and Visualization: Communicating data insights using charts, graphs, and other visual aids.
1. Data Collection
Data collection is the initial step in the Data Analytics process. It consists of gathering information from various sources to build a dataset that analysts will use for examination. This step is crucial as the quality and comprehensiveness of the data directly impact the accuracy of the insights derived from it. Surveys and questionnaires, databases, web scraping, IoT (Internet of Things) devices, social media platforms, logs and records, external databases, etc., provide rich information that analysts and researchers can tap into for gaining insights and conducting analyses.
Ensuring the quality of the collected data is critical for accurate analysis and meaningful insights. Therefore, Data Quality Assurance involves critical processes like accuracy, completeness, consistency, relevance, timeliness, validity, and integrity.
2. Data Cleaning and Preparation
Data Cleaning and Preparation is similar to preparing a room for a party. It's about ensuring the data is in top shape before we dive into analysis, preventing missteps and providing accurate results. Handling missing values is like filling in the gaps of a puzzle - we figure out what should be there based on the surrounding pieces. This step ensures our analysis is complete and reliable.
Additionally, Data Transformation is like organising a wardrobe for easy access - it involves reformatting data to make it more manageable and understandable. This process allows us to see the bigger picture more clearly, setting the stage for practical data analysis.
3. Data Analysis
Data analysis is similar to solving mathematical puzzles. It helps us to recognise trends and make wise choices. Descriptive analytics is like taking a picture of the data, simply showing us the big picture.
Exploratory data analysis (EDA) is like exploring a new place, looking closely at all the details to find exciting things we might have missed. EDA is like exploring the data to understand it better. Together, these steps help us understand information better and make better choices.
4. Data Modeling
Data modelling provides an organised representation of data, like drawing out a building's plan. Making forecasts and reaching meaningful conclusions is built upon it. Consider models as tools in a toolbox, each created for a particular purpose. Regression, for instance, helps predict numbers, whereas machine learning models can learn and produce more complicated predictions.
Once we have our models, we must figure out which works best. It's like trying different tools to see which one does the job right. This step is essential to make sure our predictions are accurate and trustworthy. It's like picking the perfect tool for a task.
5. Interpretation and Visualization
Once we've constructed our model, it's like having a map in our hands. However, just like with a map, we need to know how to interpret it. Tools like Tableau, Power BI, Google Data Studio, and programming libraries like Matplotlib and D3.js are used to analyse data. They enable us to create clear charts and graphs, making it easy to identify trends and patterns in the data.
We can refer to it as having a visual guide that enhances our understanding of the information. Once we have found something valuable, like a hidden treasure, we love to share it with others. In data analysis, it is the same. We need to communicate our discoveries with others in a way that's clear and easy to understand.
Types of Data Analytics
There are four main types of data analytics, each tailored to address specific aspects of data exploration and utilisation:
1. Descriptive analytics: These provide an in-depth description of past events. Like a historian documenting events, it summarises historical data to show us trends, patterns, and essential lessons. The context that descriptive analytics provides serves as a basis for subsequent analysis. (Tells us what happened)
2. Diagnostic Analytics: Diagnostic analytics is the investigator of the data world that seeks to answer the question "why." For example, diagnostic analytics can help determine the reasons behind declining sales data. It's like a medical diagnosis, identifying the root causes behind specific outcomes. (Tells us why something happened)
3. Predictive analytics: Predictive analytics uses historical data, statistical models, and machine learning algorithms to forecast future trends and events. It enables businesses to anticipate what's coming, facilitating proactive decision-making. (Tells us what will likely happen in the future.)
For instance,
- What was the impact on ice cream sales during the last heatwave?
- Based on customer preferences and market trends, which products will be in high demand next month?
4. Prescriptive Analytics: Think of prescriptive analytics as having a personal decision-making coach. In addition to making actionable suggestions for improving those results, prescriptive analytics also predicts what will happen. It functions similarly to a GPS that tells you where to go and provides the best route. (Tells us how to act)
In conclusion, each of the four categories of data analytics—descriptive, diagnostic, predictive, and prescriptive—serves a distinct function in concluding data. Descriptive provides historical context, diagnostic investigates causes, predictive forecasts future trends, and prescriptive offers actionable advice. Together, they empower informed decision-making. When a company reaches the stage of prescriptive analytics, we usually refer to it as “Evolved Organisation”.
Techniques and Tools
Data analysts utilise various techniques to process data. Some widely used methods include:
Data analysis techniques
1. Data Mining Techniques: Uncover hidden patterns and trends in data for informed decision-making.
-Clustering: Group similar data points to identify customer segments and buying patterns.
-Association Rules: Identifying patterns and relationships between items.
2. Statistical Analysis: Understanding data through patterns for evidence-based decisions.
-Hypothesis Testing: Validate assumptions about populations based on sample data.
-Regression Analysis: Predict outcomes based on historical data.
3. Machine Learning Algorithms: Train computers to make intelligent predictions and decisions.
-Decision Trees: Simplify complex decisions into clear and manageable steps.
-Neural Networks: Empower computers to learn and analyse information like the human brain.
Data analysis tools
1. Python: A versatile programming language with powerful libraries like NumPy and Pandas.
2. R: A specialised language for statistical analysis and data visualisation.
3. Tableau: A user-friendly tool for creating interactive dashboards and reports.
1. Data Mining Techniques: Data mining techniques are similar to skilled detectives for your data. They dig through data to look for trends and insightful data. These techniques aid in the improvement of commercial decision-making. For instance, they can use clustering to group related data points or association rules to find trends in consumer behaviour. In the modern world, these techniques are crucial for maximising the potential of data.
Clustering
Clustering is like sorting a group photo. It groups similar data points based on shared characteristics. For example, customer segmentation helps identify groups with similar buying habits.
Association Rules
Association rules are like recognising shopping habits. They uncover connections between different items in a dataset, aiding strategies like offering product bundles or making recommendations.
2. Statistical Analysis: Statistical analysis is like the language of numbers that helps us make sense of data by uncovering patterns, relationships, and insights. This technique is crucial for making informed decisions based on evidence. It includes techniques like hypothesis testing and regression analysis.
Hypothesis Testing
Hypothesis Testing is checking if an assumption about a population is likely valid based on a sample. It's like making an educated guess and then using data to see if you're right. For instance, a taste test helps decide whether people prefer one flavour.
Regression Analysis
Regression Analysis is like finding the best-fit line on a graph. It helps us see how one thing (like advertising) affects another (like sales). For example, it can show us if spending more on ads leads to higher sales. It is a helpful tool for making predictions based on data.
3. Machine learning Algorithms: Machine learning algorithms act as the brains of computers, solving problems intelligently. They learn from data and make predictions or decisions without being explicitly programmed. It includes techniques like:
Decision Trees
Decision trees are visual guides for making choices. They simplify complex decisions by breaking them down into smaller, manageable steps. As a result, they are user-friendly and straightforward to follow, ensuring effective decision-making.
Neural Networks
Neural networks act as the artificial intelligence of machines, which function similarly to the human brain to analyse information. They are tremendously helpful for understanding languages and image recognition.
4. Tools for Data Analytics: Python, R, and PowerBI help turn raw data into meaningful insights. Data analysts use essential tools such as
Python (with libraries like Pandas NumPy)
Python is like a Swiss army knife for data analysts since it has many functions. Strong libraries like NumPy for managing numerical operations and Pandas for handling data processing give Python an upper hand in data analytics. The combination makes Python a favoured choice for many analysts due to its flexibility and efficiency.
R
R is similar to a specialised toolkit for statistical analysis and visualisation of data. It excels in creating insightful charts and graphs, making it an invaluable resource for analysts seeking to represent data clearly and compellingly.
Tableau
Tableau functions like an artist's canvas, transforming raw data into visually engaging dashboards and reports. Its intuitive drag-and-drop interface empowers users to create impactful visualisations without advanced coding skills. This accessibility makes Tableau popular for generating insightful and actionable visual representations of data.
These techniques establish the basis for making well-informed decisions, including machine learning, statistical analysis, and data mining. Analysts can unleash the full potential of data by combining it with sophisticated tools like Python, R, and Tableau to transform it into helpful business outputs.
Advantages and Importance of Data Analytics
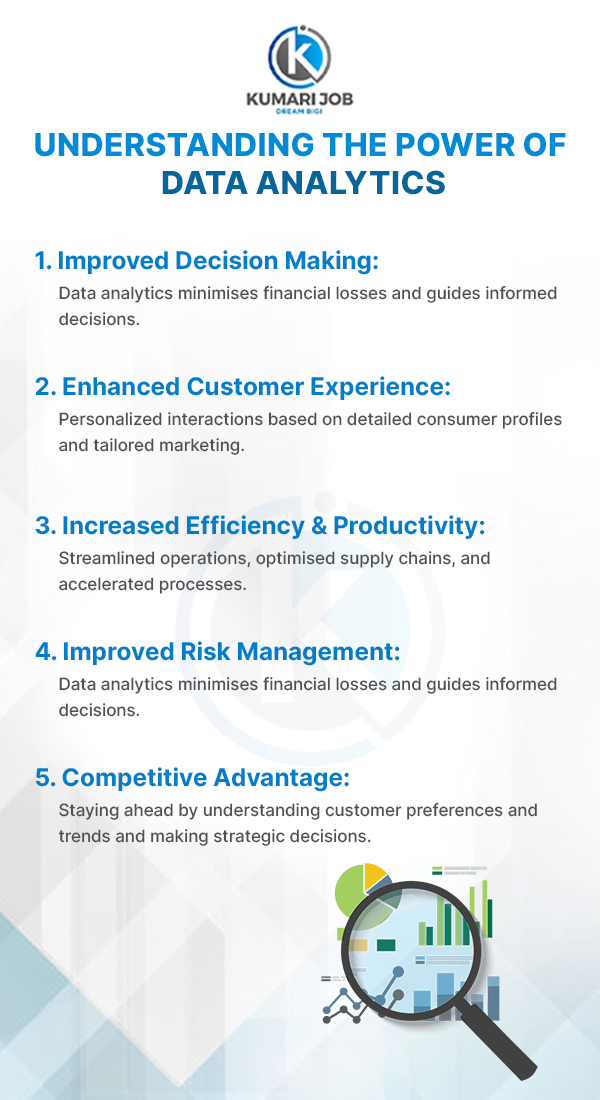
Have you ever wondered about the potential of data analytics in businesses? Let's explore five advantages of data analytics prioritised by every company.
1. Improved Decision Making
Businesses can use data analytics to make informed decisions and minimise financial losses. A Deloitte survey found that 49% of respondents believed analytics helps them make better decisions. Predictive analytics helps anticipate how changes in the business might play out, while prescriptive analytics provides recommendations on how to respond to these changes.
For example, a company can simulate adjustments in pricing or product offerings to see how they affect customer demand. They can then test these changes in real-world scenarios. Using data analytics tools to analyse sales data for the altered products, companies can assess the impact and decide whether to implement these changes more widely.
2. Enhanced Customer Experience
Companies collect client information from various places, including physical businesses, online marketplaces, and social media. They can create detailed consumer profiles using data analytics, gaining insightful knowledge regarding client behaviour for a more personalised experience.
Imagine a clothing retailer operating both offline and online. The business might create a customised social media marketing plan by looking at sales data and social media interactions. These ads would concentrate on product categories aligned with consumer tastes to increase online sales.
A Deloitte survey found that 10% of respondents believe data analytics helps them form stronger relationships with clients and business partners, highlighting its significant advantage. Additionally, businesses can use customer data to use behavioural analytics models to improve the customer journey.
For instance, a company might use predictive models on online purchases to make complementary product suggestions at the point of sale, enhancing sales prospects. The total client experience is greatly improved by this tactical application of data analytics, which may result in increased income streams.
3. Increased Efficiency and Productivity
Data analytics is a game-changer for businesses, enhancing operational efficiency. It is accomplished by collecting and analysing supply chain data, identifying manufacturing delays or bottlenecks, and anticipating possible issues. For instance, if a demand estimate indicates that a vendor would find it challenging to meet demand over Christmas, a business can make alternate arrangements to avoid delays.
Data analytics are essential for retail, especially regarding efficient inventory management. It determines the optimum supply levels for all items while considering seasonality, special occasions, and long-term trends. Consider it a business-related version of a turbocharger that improves performance. Process analysis and improvement can enhance business operations. A delivery service, for instance, can utilise data to determine the shortest routes, saving both time and resources. Processes are accelerated, and everything functions more smoothly, thus increasing productivity.
4. Improved Risk Management
Any business faces risks that range from theft to legal troubles. Data analytics saves the day by assisting companies in recognising and preventing risks. For instance, a retail chain can effectively implement security measures using statistical models to anticipate which outlets are more vulnerable to theft.
Data analytics also helps to reduce losses when setbacks occur. For instance, a company can utilise data to determine the best rates for clearance sales if it has extra inventory. A shield of data analytics protects organisations from unforeseen problems. Companies operating data analytics for risk management reported a considerable decrease in financial losses. For example, insurance companies use data to forecast high-risk locations, enabling them to provide greater coverage and lower financial exposure.
5. Competitive Advantage
Staying ahead of the curve is essential in today's fast-paced corporate world. Data analytics is the hidden weapon that enables firms to stay up with the competition and take the lead. Understanding the market, getting to know your clients, and anticipating their needs depends on it.
Data analytics lets businesses get current insights into customer feedback and product performance, enabling them to consistently modify and improve their product offerings to satisfy customers' needs. Companies can use data analytics to closely monitor their rivals and make strategic decisions that help them stand out.
Companies can make moves that leave their competitors in the dust by grasping market trends and understanding customer preferences. For instance, an e-commerce platform can use data to serve up personalised recommendations, giving them a clear advantage over other online stores.
In a nutshell, data analytics is the guiding light showing organisations how to succeed. It is the tool that helps businesses make better decisions, streamline processes, strengthen customer relationships, prepare for any problem, and truly stand out in the marketplace.
Mastering Skills for Data Analysis
The demand for experts who can work with data, such as analysts and scientists, grows yearly. An organisation that monitors employment in the US estimates that from 2021 to 2031, analysts will have 23% more job openings. The data is way above the average job growth rate of just 5%.
According to Linkedin, A data analyst must have a sharp analytical mind. Finding patterns, trends, and anomalies within datasets is necessary for this. Finding the best statistical analysis methods requires the use of critical thinking skills.
So, what abilities are needed to work well with data? Let's examine them in more detail and the steps you may take to learn them.
1. Technical Skills
There are various technical skills you should learn if you want to become a successful data analyst. SQL is an important skill. It's similar to a specific language that enables you to communicate with databases and obtain the required data.
Additionally, you should be familiar with statistical programming languages. These are tools that facilitate data understanding and manipulation. Another functional ability is the usage of spreadsheets. They are like large grids where data can be entered and organised.
Visualising data is equally crucial, which entails creating images or graphs that convey the information. It helps people understand the data better. Knowing about machine learning is a bonus. The goal is to teach computers how to learn from data and make decisions.
Understanding data warehousing and data preparation is also helpful. Data warehousing is like a giant storage place for lots of data. Data preparation is getting the data ready for analysis. These skills together make a strong foundation for a data analyst.
2. Analytical Skills
A good data analyst involves more than technical skills. It's also about having strong analytical abilities. Let's break down some important ones:
- Critical Thinking: This means looking at information carefully and thinking deeply about it. It is like asking lots of questions to understand what's going on. For a data analyst, it helps to determine what data is essential and how to use it.
- Problem Solving: Data analysts often face puzzles that need solving. It's like being a detective, trying to find the best way to answer a question using data. This skill is about finding creative solutions and making things work.
- Attention to Details: Be careful with the little things. In data analysis, even a tiny mistake can lead to wrong conclusions. So, paying close attention to every detail in the data is essential.
- Statistics: The language of data. It helps us understand if something is just a coincidence or a crucial piece of information. Knowing statistics helps data analysts make sense of the numbers they're working with.
- Domain Knowledge: Understand the area or industry you're working in. For example, if you're analysing data for a hospital, it helps to know about healthcare. This way, you can better understand the data and what it's telling you.
These analytical skills help ask the right questions, find solutions, and ensure accurate data.
3. Communication Skills
Technical proficiency is only one aspect of a data analyst's job; effective communication is also crucial.
Among them is public speaking as one aspect. This ability enables analysts to communicate their findings and perspectives to a broader audience. It involves effectively and engagingly communicating complex information so the audience can quickly understand the main points.
Verbal communication is equally important. It includes both individual and group discussions. For collaborative work environments to be successful, participants must be able to communicate results, ideas, and potential solutions effectively. This ability guarantees that team members may act on insights when understood.
Data analysis depends on collaboration. Addressing complicated data requires working closely with coworkers, sharing information, and combining resources. Data analysts must communicate clearly and effectively in written reports, oral discussions, or group projects. It guarantees that others can absorb and act on their ideas, enabling them to understand and analyse data.
A data analyst's work has a more significant impact when they have strong communication skills since they allow better educated and empowered decision-making.
4. Industry-Specific Skills
Besides technical and analytical abilities, data analysts benefit from industry-specific skills that enhance their effectiveness in their roles.
Writing is a crucial skill that enables analysts to communicate their findings in written and concise form. It involves having the capacity to produce reports, summaries, and documents that clearly explain complicated data to both technical and non-technical stakeholders. Writing clearly and concisely ensures that insights are effectively communicated and usable for decision-making.
Another essential skill for data analysts is project management. It involves having the capacity to plan, coordinate, and carry out projects involving data analysis. Project Management includes developing timelines, prioritising tasks, and effectively using resources. Timely and cost-effective completion of data analysis projects with effective project management produces more significant and valuable findings.
As research involves acquiring and analysing data from numerous sources, it is a crucial skill for data analysts. This study could include analysing market dynamics, researching the competitive environment, or researching industry trends. By placing their findings within the larger industry context, analysts with solid research abilities can better understand the implications and uses of the data.
Data analysts are better prepared to succeed by combining technical competence and analytical expertise with these industry-specific abilities.
Additional Resources
Some recommended resources for further learning in data analytics are as follows:
Books:
- "Python for Data Analysis" by Wes McKinney
- "Data Science for Business" by Foster Provost and Tom Fawcett
- "Practical Statistics for Data Scientists" by Andrew Bruce and Peter Bruce
- "Data Science for Dummies" by Lillian Pierson and Jake Porway
- "Storytelling with Data" by Cole Nussbaumer Knaflic
Online Courses and Platforms
1. Coursera:
- Data Science Specialization" by Johns Hopkins University
- "Google Data Analytics Professional Certificate" by Google
2.edX: - "Data Science MicroMasters Program" by UC San Diego and Delft University of Technology
3. Udemy: - "Complete Data Science Bootcamp 2021" by 365 Careers
4.LinkedIn Learning: - "Data Science Foundations: Fundamentals" by Barton Poulson
Websites and Blogs:
- Kaggle
- Towards Data Science (Medium publication)
- DataCamp
Youtube Channels:
- Corey Schafer
- Sentdex
Podcasts:
- Data Skeptic
- Not So Standard Deviations
Remember to put what you have learned into practice by working on practical projects or participating in coding competitions. Practical experience is essential for ensuring you fully comprehend data analytics fundamentals.
Conclusion
Mastering data analytics brings up a world of opportunity in today's data-driven world. The potential is endless, from understanding unprocessed data to making wise decisions. Remember that data is like a puzzle; data analytics is key to revealing valuable insights. You can meet obstacles in the real world by refining your technical abilities and embracing critical thinking.
Remember, data is the heartbeat of modern decision-making, and by mastering these skills, you are prepared to succeed in this fast-paced industry. So, whether you're just starting or looking to refine your skills, you're stepping into a field with immense growth and impact potential. Continue your research and education, and confidently explore the fascinating world of data analytics!
I would love to hear from you if you think I need to include anything or if you want to share your experiences or views. After all, each person adds a unique perspective to the field of data analytics. So continue the discussion, and let's continue learning together!
Read more related articles: https://kumarijob.com/careertip.
Frequently Asked Questions
- Data analytics analyses and interprets the collected data to find insightful patterns, trends, and relationships. It's a technique for organising a lot of data, which may be presented in text, numbers, or visuals.
Data analytics serves several crucial functions and enables businesses to understand their operations and customer behaviour better. It aids in identifying areas for improvement, optimising processes, and making predictions about future trends. Data analytics also plays a pivotal role in detecting anomalies or irregularities in data, which can indicate potential issues or opportunities.
- To become a data analyst, one typically follows these steps:
- Educational Foundation: Build a strong background in statistics, mathematics, computer science, or data science.
- Tool Proficiency: Learn essential tools like Excel, SQL, Python, or R for data analysis.
- Practical Experience: Gain hands-on experience through projects or internships to apply theoretical knowledge to real-world data.
- Specialisation: Focus on specific areas like machine learning, business intelligence, or data visualisation within data analytics.
- Continuous Learning: Stay updated with the latest trends and tools through online courses, workshops, and industry publications.
The role of business analytics in decision-making is as follows:
- Makes use of data to support decision-making with evidence.
- Makes predictions based on past events.
- Optimises business operations.
- Adapt offerings as per client behaviour.
- Makes strategic decisions with insight backed by data.
The benefits of big data analytics are as follows:
- Informs better decision-making.
- Enhances customer experience.
- Optimises operations for efficiency.
- Provides a competitive edge.
- Drives innovation and product development.
Submit your comments

Get Our App On


Scope of BA in Nepal: Career, Salary, and Job Opportunities
VIEW DETAILS
How to Apply for World Vision International Nepal Vacancy?
VIEW DETAILS
How to Apply for the UNESCO Nepal Internship?
VIEW DETAILS
Scope of Nursing in Nepal: Career Opportunities, Salary & Future Growth
VIEW DETAILS


Loading Comments...